

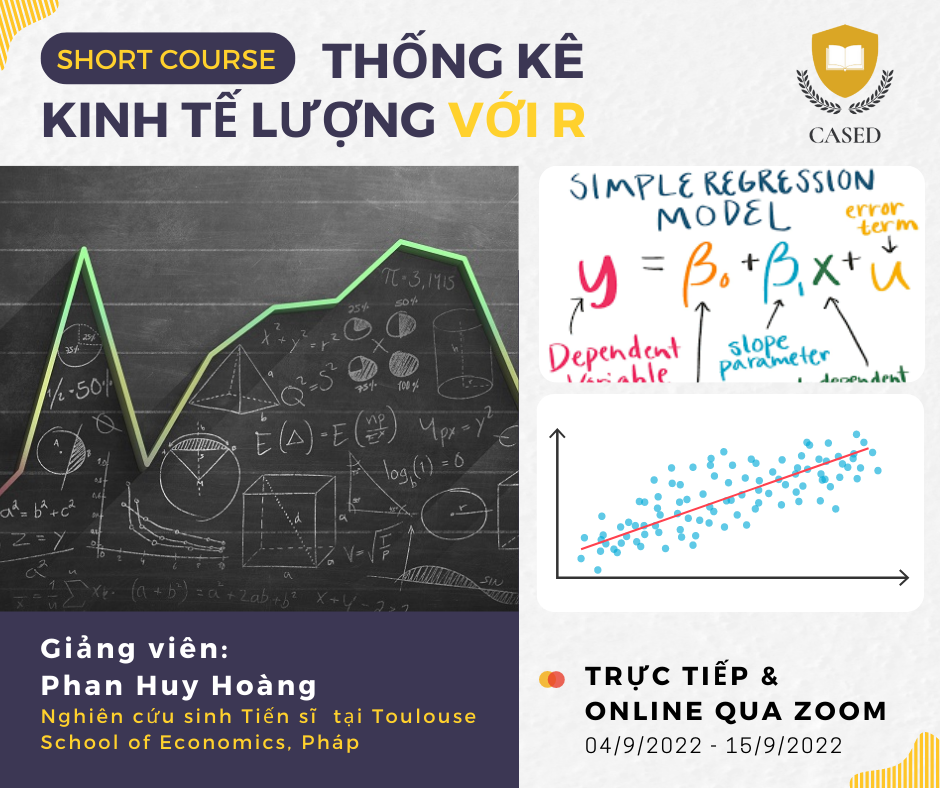
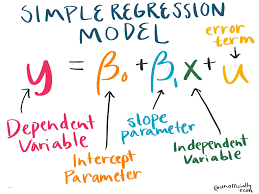
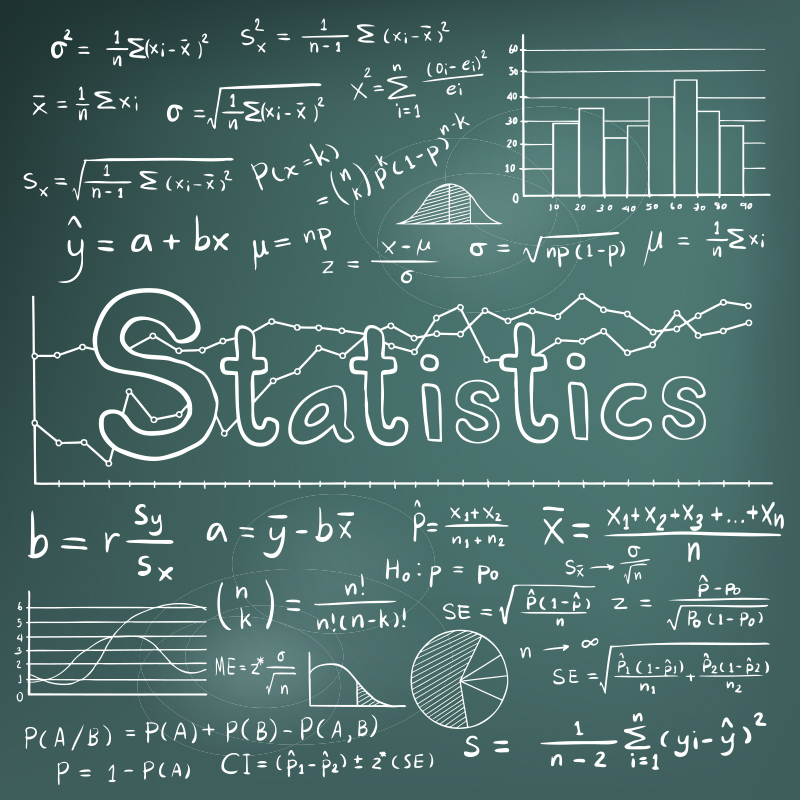
The “Econometrics Statistics with R” course introduces a number of topics and tools in applied statistics and econometrics, with exercises and practice using the R language. Theory and practical exercises are designed to combine in the course to create a visualization for learners, helping learners to connect known (or will-know) theories to actual research and analysis.
Students should have an introductory knowledge of statistics and econometrics. At the same time, they should know the basic commands in R before starting the course, including how to start, create vectors, assign variables, algebraic operations, create basic loops, and create basic functions.
 Student Benefits