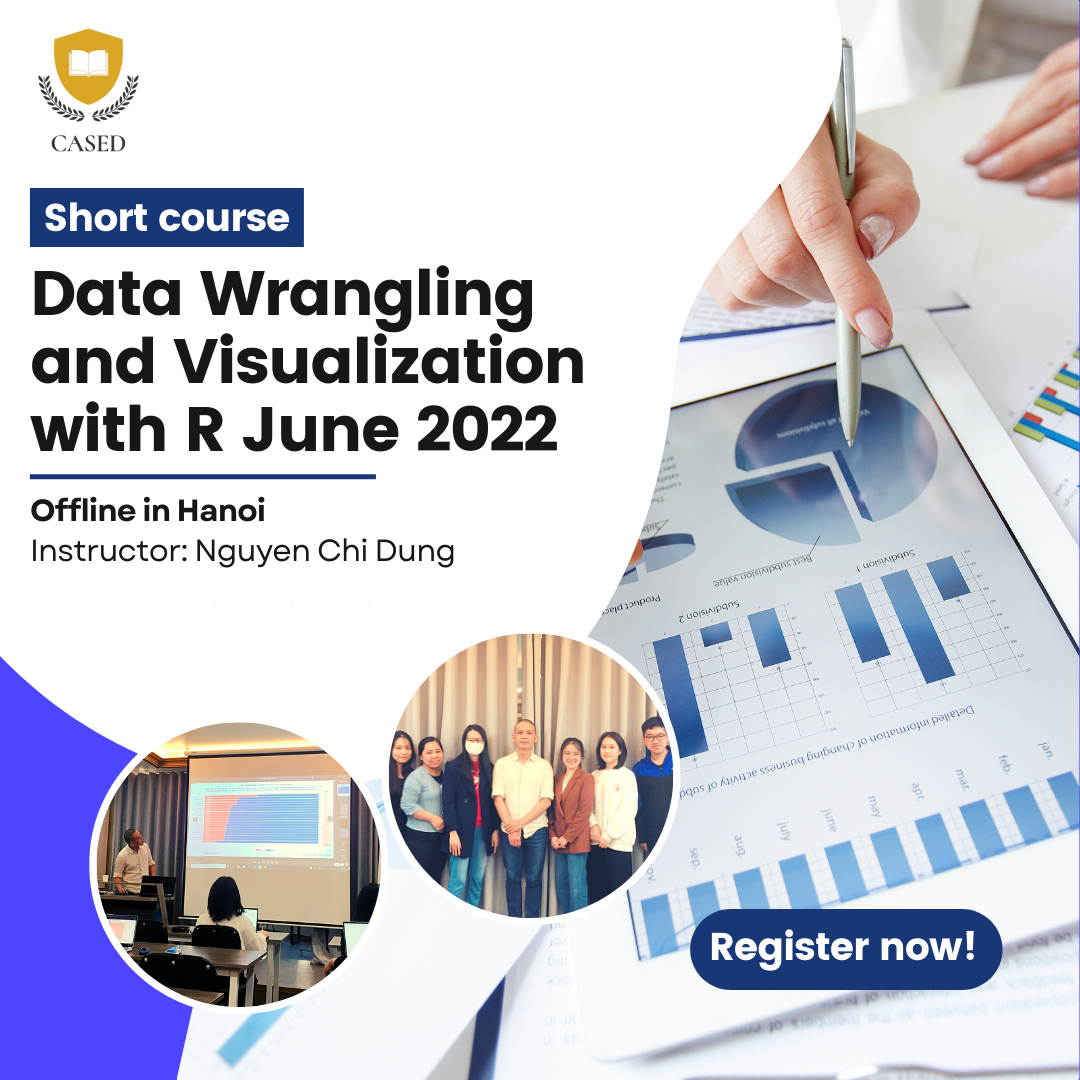
Data Science knowledge is emerging as a necessity in almost every field. The application of data analysis to economic, financial, and business research and analysis is an inevitable trend.
Among many currently available data analysis tools, R is a programming language commonly used in machine learning, statistics, data analysis, and scientific research. It is one of the most common languages used by statisticians, scientific researchers, market researchers, project officers, and economic, financial & business analysts.
The Data Wrangling and Visualization with R course at CASED is a course for beginners to intermediate-level students with this programming language.
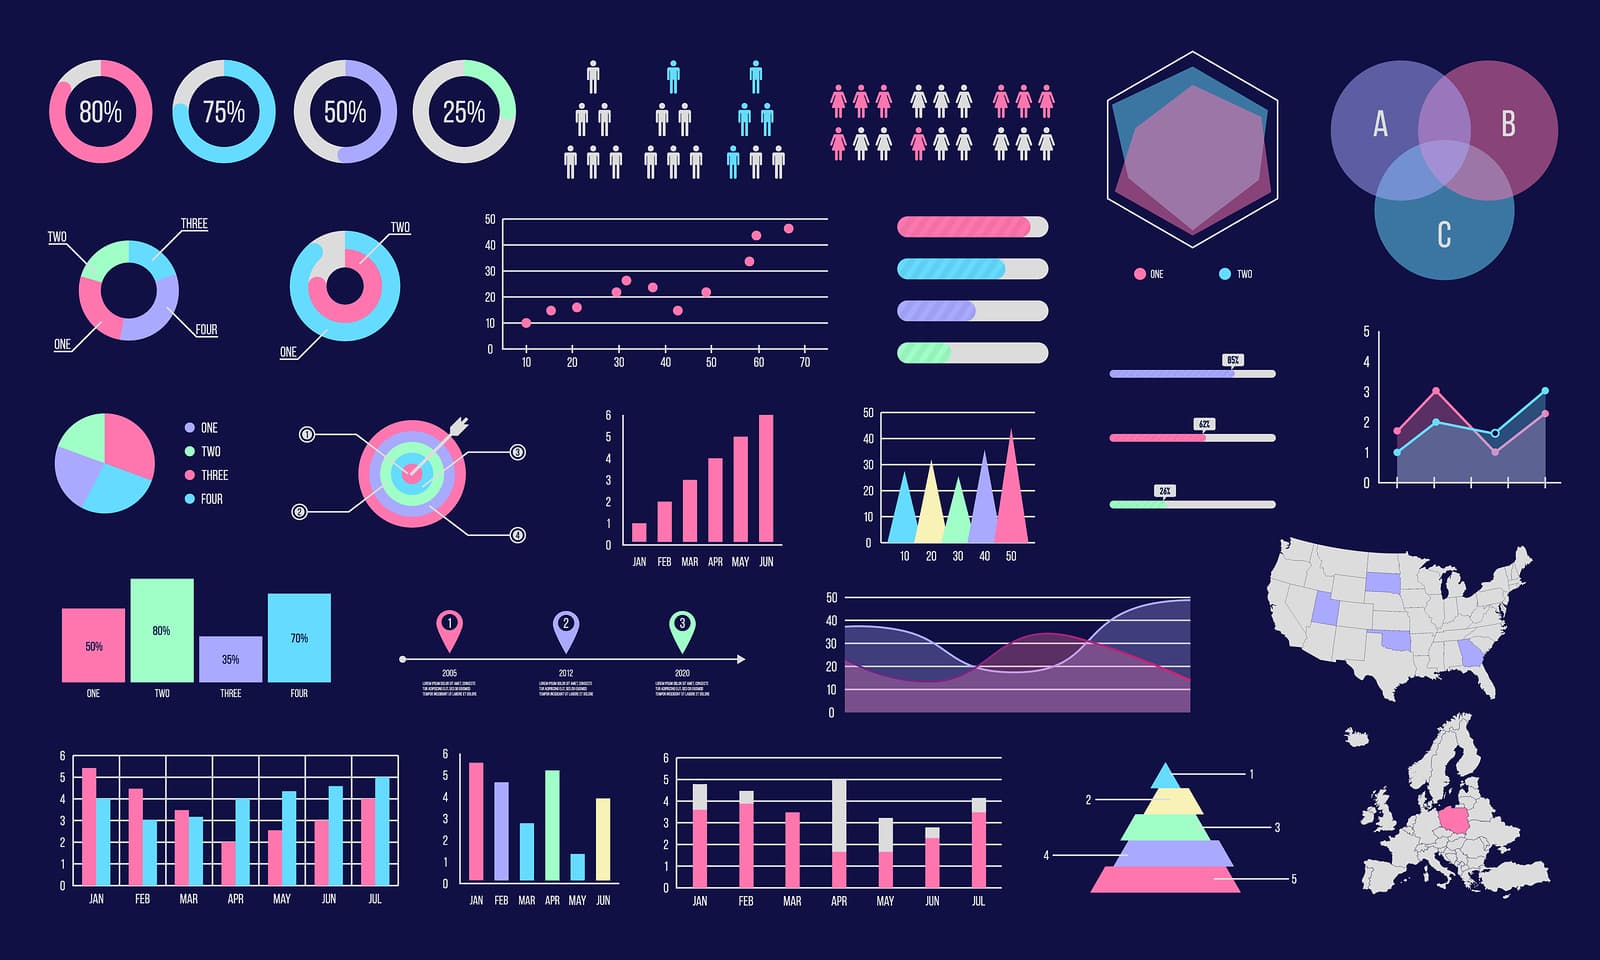
With a theoretical approach and parallel practice, by the end of the course, students will be equipped with the skills needed to collect, process data and create high-quality charts/graphs for reporting through class work and completing the graduation project at the end of the course.


 Student Benefits
Trần Đạt Tín – Học viên lớp Data Wrangling and Visualization with R 11/2021
I feel that the course has helped me to have the background knowledge so that I can teach myself later about data processing and visualization later. As a math student, the course is very useful for me when I use it in statistics and probability subjects. In particular, the lecturer has provided very good resources and materials for self-study after the course.